Rego Renewal Excel Template – Free (2026)
0
Free download
Rental property cash flow Excel template for Australia. Compare nine-property forecasts with twelve months of actual cash, including principal and other costs.
This rental property cash flow Excel template gives you two useful views: an annual forecast for up to nine properties and a twelve-month log of actual portfolio cash movements. Keep those views separate. A rent assumption is not money received, and a profitable-looking forecast does not pay this month’s loan bill. The workbook uses AUD, includes principal repayments and other cash costs, and flags incomplete records before they reach the dashboard.
| Sheet | Use it to answer | Where the numbers come from |
|---|---|---|
| Property Portfolio | What might this property contribute over a year? | Your rent, vacancy, loan and cost assumptions. |
| Monthly Cash Flow | What cash actually came in and went out? | Bank statements and property manager statements. |
| Dashboard | How do the annual forecast and recorded actuals look? | The two separate sheets, clearly labelled. |
| Instructions | What do the inputs and checks mean? | A guide included in the download. |
Changing weekly rent in Property Portfolio will not fill or update the actual monthly log. That separation is intentional. Enter actual cash when you can reconcile it to source records, even when it differs from the forecast.
Start by replacing the nine fictional properties with your own. Each needs a unique property ID. Enter interest and management rates as percentages, such as 6.1% and 6.5%. Typing 6.1 into a percentage input means 610%, so the check will reject it.
For tenancy-level records behind the monthly receipts, use a rental ledger to track rent charged, payments received and outstanding balances separately from the portfolio forecast.
The first fictional property has weekly rent of $620, two vacant weeks, an assumed loan balance of $465,000 and a 6.1% annual interest rate. Its 6.5% management fee applies to forecast rent after vacancy.
| Cash item | Calculation or input | Annual amount |
|---|---|---|
| Rent after vacancy | $620 × (52 − 2) | $31,000 |
| Interest assumption | $465,000 × 6.1% | $28,365 |
| Management fee | $31,000 × 6.5% | $2,015 |
| Council / water and insurance | $2,450 + $980 | $3,430 |
| Repairs and strata / other costs | $1,000 + $2,000 | $3,000 |
| Loan principal and capital spending | $3,000 + $500 | $3,500 |
| Total cash outgoings | Sum of the outgoing categories | $40,310 |
| Cash after debt | $31,000 − $40,310 | −$9,310 |
A negative result stays visible. It shows the cash the scenario would need from elsewhere, before any separate tax assessment. Entering zero principal changes this example to −$6,310, while the interest assumption remains $28,365. That makes the difference between interest and principal easy to inspect.
The interest formula is a simple constant-balance estimate. It does not model an amortising loan, daily interest, an offset account, refinancing or a changing rate. Use lender figures or a separate loan schedule when those details matter, and reconcile actual interest in the monthly sheet.
Maintenance, strata, water charges and other cash costs can change the result substantially. The ASIC Moneysmart guide to investment property lists common ongoing and acquisition costs and explains why vacancy and borrowing costs need to be considered in a property budget.
Cash after debt is not taxable rental profit. The file does not calculate depreciation, deductions, tax refunds, capital gains or ownership splits. Keep your tax working separate from the cash view rather than adding an assumed refund to make a negative forecast positive.
Actual cash invested is also a manual input. Include the relevant deposit and cash-funded acquisition costs for the scenario, without counting borrowed funds as your cash. The example uses $170,000 for RP-01: a $155,000 purchase-price gap plus $15,000 of illustrative acquisition cash. Its forecast cash-on-cash result is −$9,310 ÷ $170,000, or about −5.5%.
Keep depreciation calculations outside this cash view with a property depreciation schedule for asset values, annual deductions and longer-term projections.
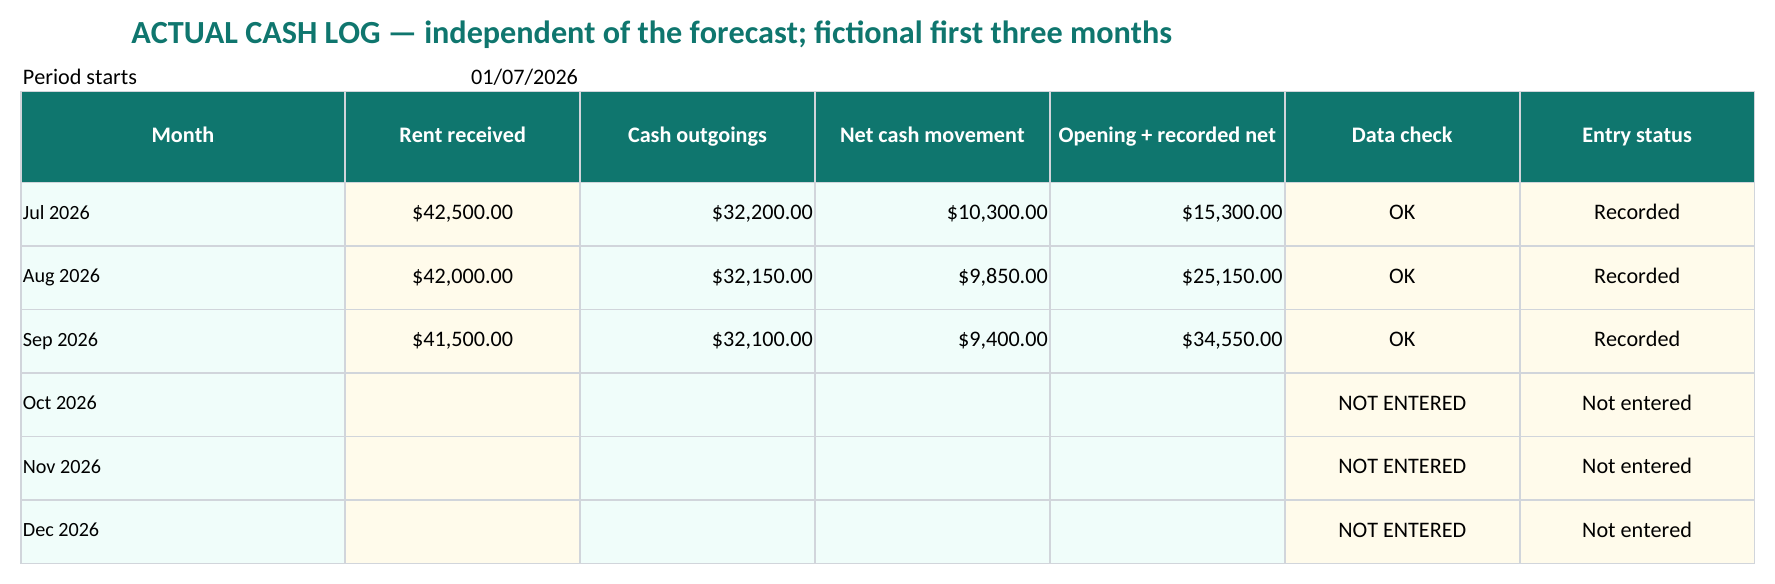
The supplied July example has receipts of $42,500 and cash outgoings of $32,200, leaving $10,300. With opening cash of $5,000, the running amount is $15,300. These are fictional actual-log examples; they are not derived from the property forecast.
Only Recorded rows passing the checks enter the actual average. The three supplied months average $9,850 net. If you add a fourth completed month with confirmed zero receipts and zero outgoings, the average becomes $7,387.50. A month marked Not entered does not reduce the average as though it had zero activity.
A running amount needs complete records
Opening cash plus recorded movements is not proof of your bank balance while months or transactions are missing. A REVIEW row also withholds later running amounts until it is corrected. Reconcile the underlying transactions, not just the headline total.
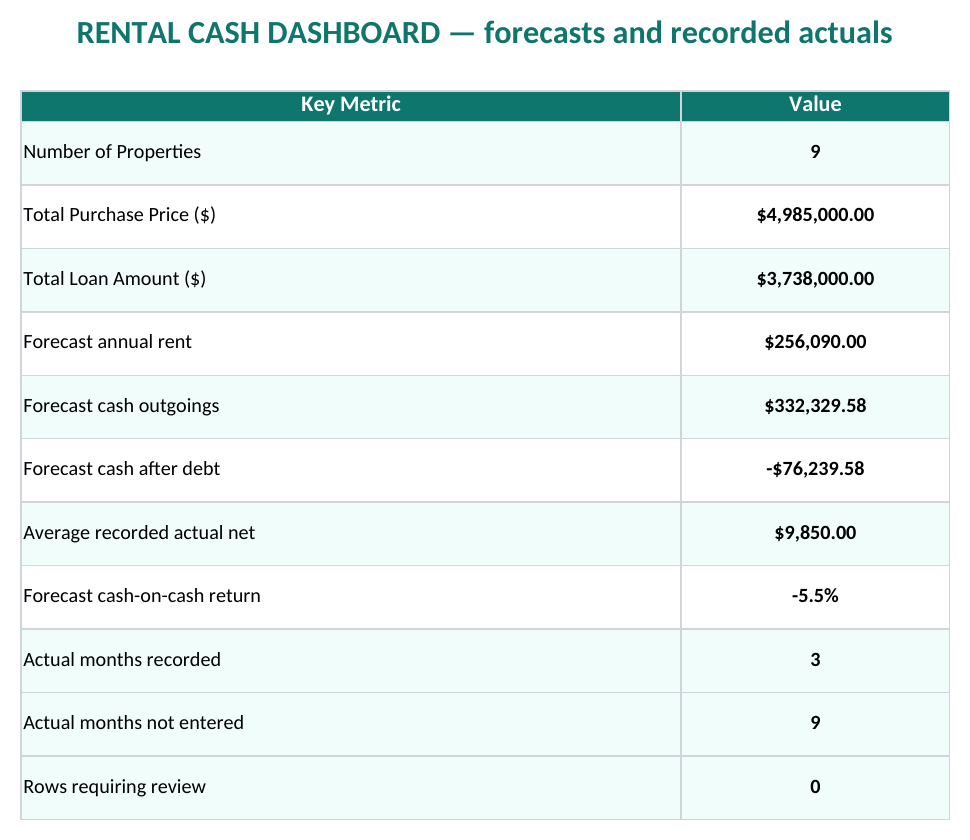
The dashboard labels annual forecast rent, forecast cash outgoings and forecast cash after debt separately from the average recorded actual net. Its three charts show property forecasts, opening cash plus recorded movements and average recorded outgoing categories. Check the number of recorded months and the REVIEW count before comparing results.
Try a simple vacancy scenario in a copy: setting RP-01 to zero vacant weeks raises its forecast rent to $32,240, and cash after debt becomes −$8,150.60. Setting vacancy to 52 weeks leaves rent and the rent-based management fee at zero while the other entered cash costs remain. The file does not automatically reduce insurance, rates or loan payments during vacancy.
Duplicate property IDs, impossible vacancy inputs, negative cash amounts and missing required figures trigger REVIEW. Those rows are excluded from totals. The prepared forecast has nine properties and the actual log has twelve months; larger models require extending checks, formulas and charts together. Filtering the sheet does not change the whole-portfolio totals.