Rego Renewal Excel Template – Free (2026)
0
Free download
Track solar generation, exports, imports, feed-in credits and net energy costs with an Australian household or small business Excel workbook.
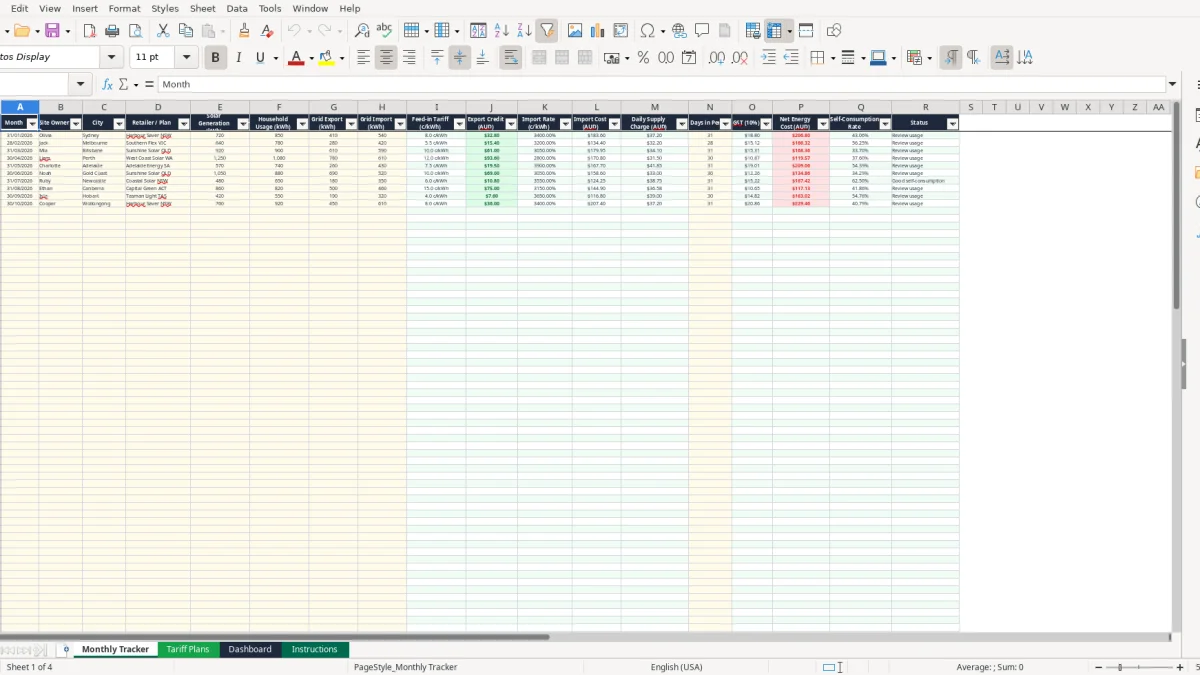
This solar feed-in tariff Excel spreadsheet records monthly generation, household usage, grid exports, imports and retailer plan rates. It calculates export credits, import costs, supply charges, GST, net energy cost and self-consumption, then summarises the results on a dashboard.
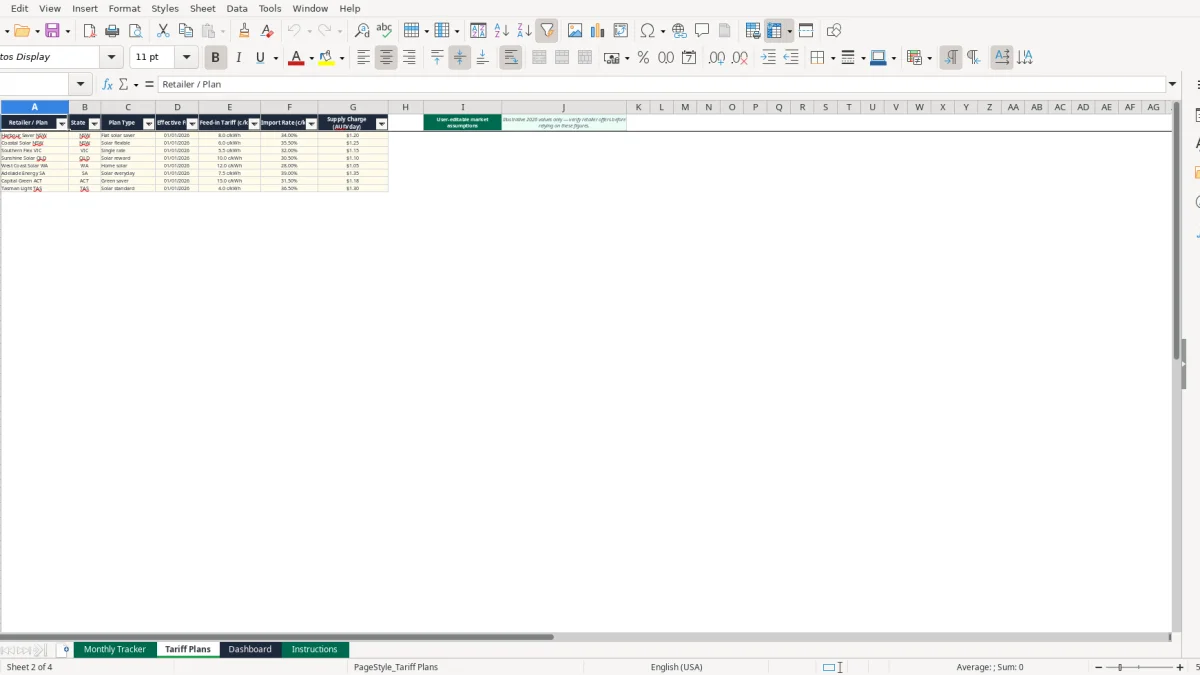
Use the Monthly Tracker for up to 100 prepared billing-period rows. The Tariff Plans sheet contains editable illustrative 2026 market assumptions, while the Dashboard brings together totals and charts for comparing solar performance across the year.
A householder with rooftop solar usually opens this spreadsheet when the electricity bill arrives, not just at the end of the financial year. The Monthly Tracker lets you compare the meter figures with the bill: generation, household usage, grid export and grid import are entered as kWh, while the selected plan supplies the rates used in the calculations.
Suppose a Brisbane household records 920 kWh of solar generation, 900 kWh of usage, 610 kWh exported and 590 kWh imported for March. Those figures are represented by the sample row for Mia and Sunshine Solar QLD. If the plan pays 10.0 c/kWh, the export credit is $61.00 before the workbook's other calculations.
The same approach suits a small business with solar on a workshop roof. An office manager can enter the meter quantities after each monthly bill, while the owner uses the Dashboard to see whether energy is being consumed on site or sent back to the grid at a comparatively low feed-in rate.
A property manager may track several sites by using the Site Owner and City columns, although each row remains a single billing-period record. A bookkeeper can use the file as a management schedule alongside the electricity invoices, rather than treating it as an accounting ledger.
The workbook includes 100 prepared rows, so a single site can be followed month by month and still leave room for additional records. The Dashboard uses all prepared Monthly Tracker rows, making accurate blank-row handling and consistent data entry important.
Image 1 shows Monthly Tracker's 18-column layout, from Month through Status. Image 2 shows the editable tariff assumptions, including state, plan type and c/kWh rates. Image 3 shows the KPI dashboard, energy split and charts, while image 4 shows the column-by-column Instructions guide.
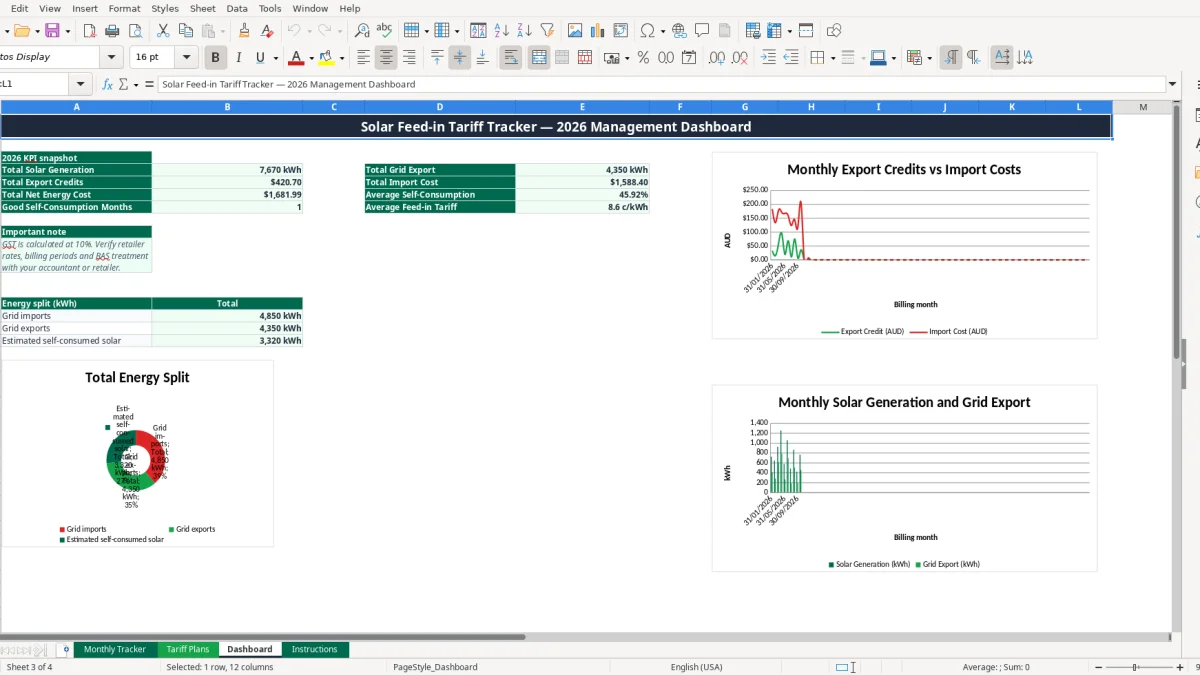
The workbook uses GST at 10%, which is the standard Australian rate for taxable supplies. Its GST formula is based on import cost plus supply charge less export credit, so the result is a spreadsheet estimate of the billing treatment rather than an ATO determination. The Dashboard itself tells you to verify retailer rates, billing periods and BAS treatment.
Use the electricity bill, retailer portal or meter report as the source for each period's generation, export and import figures. The Tariff Plans sheet is deliberately labelled as user-editable market assumptions and says its illustrative 2026 values must be verified before reliance. This matters because a plan can change its feed-in tariff, import rate or daily supply charge.
For example, a 31-day bill with a $1.20 daily supply charge produces $37.20 before any other energy calculation. If imports are 540 kWh at 34.0 c/kWh, the import cost is $183.60. If exports are 410 kWh at 8.0 c/kWh, the export credit is $32.80. Entering the actual bill values is more reliable than copying a comparison-site headline rate.
A household normally does not claim GST credits merely because an electricity bill shows GST. A registered business may have a different treatment where the premises and usage relate to taxable business activities, and its BAS records need to agree with the tax invoices and accounting records.
The workbook is not a BAS form and does not determine business-use apportionment. Keep tax invoices and supporting records for the ATO's usual five-year record-keeping period, and do not assume that the displayed net energy cost is the amount to report without checking the underlying bill and business-use position.
The most expensive mistakes in solar tracking are usually small data mismatches repeated over several bills. A monthly export figure copied into the generation column can make the household appear far more efficient than it is, while a wrong plan selection can change every credit and cost in the row.
Generation, usage, export and import are energy quantities in kWh. Feed-in and import rates are prices in c/kWh. If 410 kWh is multiplied by 8.0 rather than divided by 100 after the cents calculation, the apparent $32.80 credit becomes $3,280.00. The workbook's formula handles the cents-to-dollar conversion, but only when the input units are correct.
Another common error is entering the invoice total in Grid Import instead of the imported kWh. A $183.60 bill amount is not the same thing as 540 kWh. The formula would multiply that amount by the import rate again, producing a meaningless result that can inflate the net energy cost by hundreds of dollars.
A 28-day bill should not be entered as 31 days, because the supply charge alone changes by $3.60 at a $1.20 daily rate. More importantly, selecting Harbour Saver NSW for a Melbourne bill applies an 8.0 c/kWh feed-in rate and $1.20 daily charge that may have nothing to do with the actual contract.
Do not overwrite the calculated columns I through M and O through R. If a formula is replaced with a typed number, later changes to the plan will not flow through, and the Dashboard may combine a mixture of live calculations and stale values.
The workbook estimates self-consumption as generation less grid export, divided by generation, capped at 100%. If generation is 720 kWh and export is 410 kWh, the result is 43.06%, which the status labels Review usage. It is not a measure of the percentage of total household usage supplied by solar, so do not use the label for that different question.
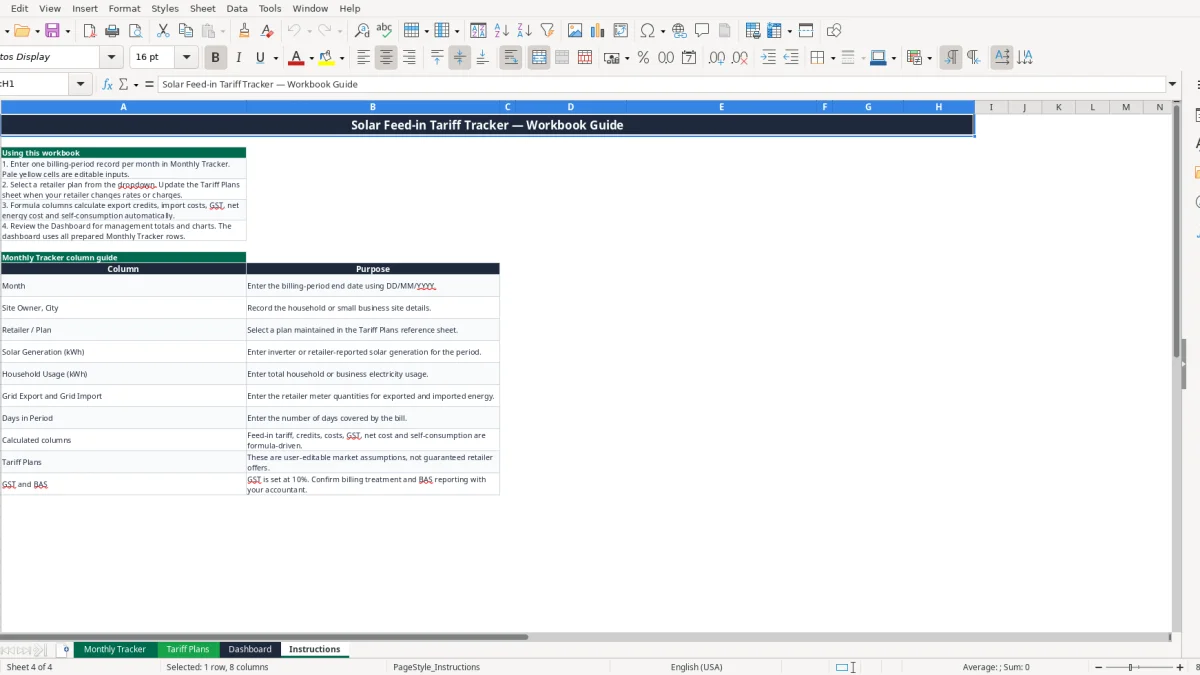
The easiest routine is to update the file when you pay or download the electricity bill. Keep the invoice open, enter one complete row in Monthly Tracker, then compare the calculated import cost and export credit with the bill before moving to the Dashboard.
For example, a household that enters 12 monthly rows can compare annual generation and exports without reconstructing the year from twelve PDF bills. If the Dashboard shows 7 Good self-consumption months but winter exports fall sharply, that is a prompt to inspect usage timing, not proof that the tariff is wrong.
Use the Tariff Plans sheet as the single place for plan assumptions. Update the existing plan row rather than creating a different spelling of the same retailer, because Monthly Tracker's VLOOKUP depends on an exact plan-name match. Record the effective date shown on the retailer material, even though the workbook does not automatically apply historical rate changes.
This workbook is suited to a household or small set of manually maintained sites. Move to software such as Xero or MYOB when you need invoice capture, bank reconciliation, multiple GST treatments, automated meter imports or an audit trail for many properties. Until then, a fixed monthly appointment and the Dashboard review are more useful than leaving twelve months of bills in an email folder.