Rego Renewal Excel Template – Free (2026)
0
Free download
Compare Australian electricity plans using supply, usage, solar, GST and estimated annual costs. Includes dashboard, lookup and 100 plan rows.
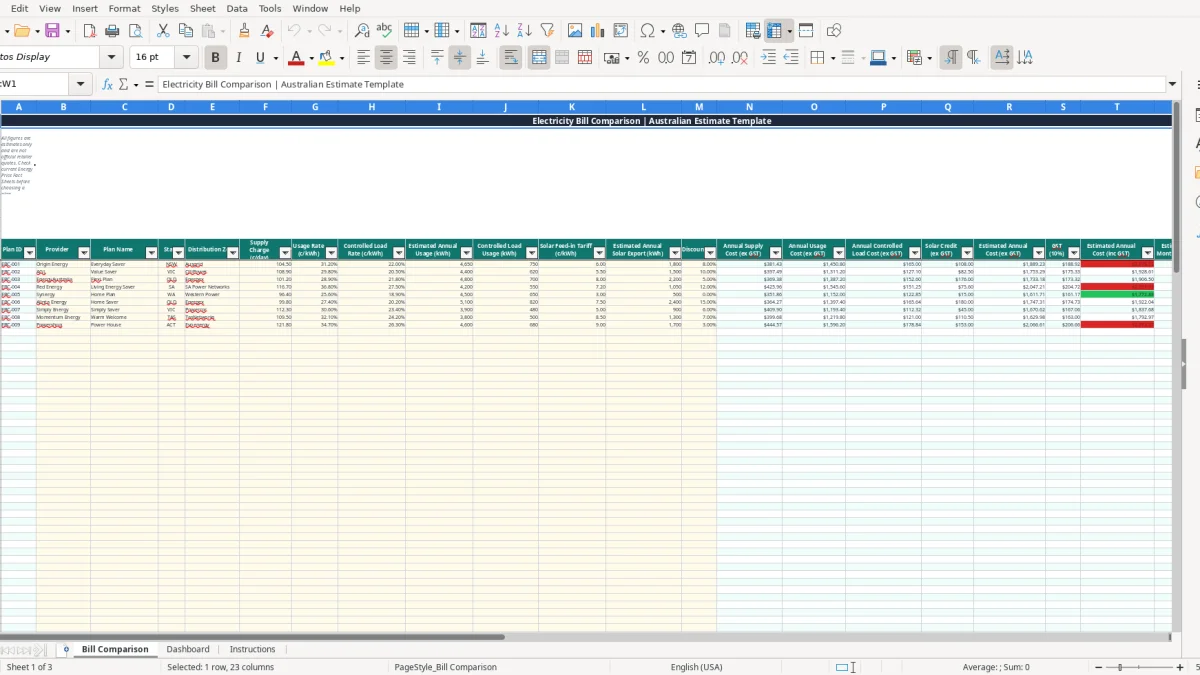
This electricity bill comparison Excel template compares Australian energy plans using supply charges, usage rates, controlled-load costs, solar credits and GST. It includes a Bill Comparison sheet with 100 prepared plan rows, a Dashboard with cost summaries and charts, and an Instructions sheet.
Enter figures from current retailer Energy Price Fact Sheets, then compare the estimated annual and monthly cost for each plan. The workbook uses 365 days and a 10% GST assumption for the financial year 01/07/2026 – 30/06/2027, but you should check every result against the retailer’s current offer for the property address.
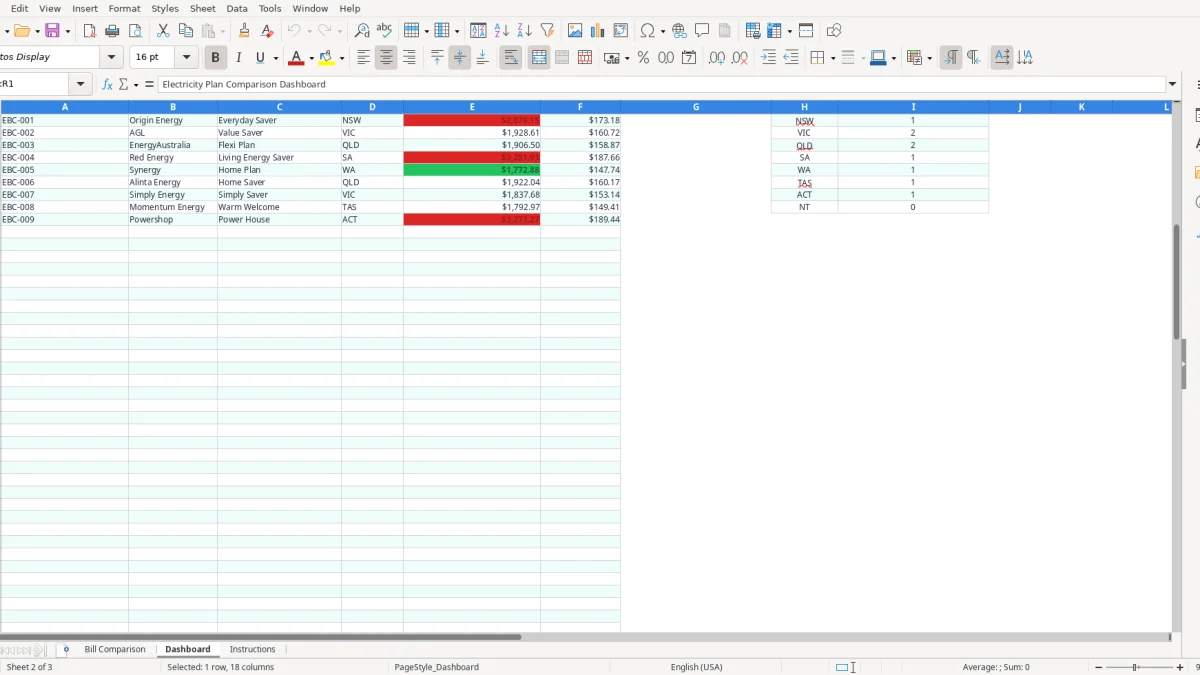
Households, landlords, small business owners and property managers use an electricity bill comparison Excel template when a contract is ending, a tenant moves in or a new property needs a realistic energy budget. The useful comparison is not simply the headline cents-per-kWh rate: you need the supply charge, tariff structure, expected usage, solar export and the distributor serving the address.
A two-adult household might use 4,650 kWh a year and export 1,200 kWh from rooftop solar. One plan could have a 104.5 cents-per-day supply charge, a 31.2 cents-per-kWh usage rate and a 6 cents-per-kWh feed-in tariff. The template turns those inputs into annual supply, usage and solar-credit figures instead of leaving you to compare disconnected numbers.
That matters when a retailer advertises a lower usage rate but charges more each day. At 4,650 kWh, a 2 cents-per-kWh difference is about $93 before GST, while an extra 20 cents per day adds $73 across 365 days. The Bill Comparison sheet keeps both effects visible.
An office manager might compare plans for a small workshop, while a property manager checks electricity costs before advertising a furnished rental. The State and Distribution Zone fields help keep offers separated because a plan for an Ausgrid address in NSW is not automatically suitable for a Victorian or Queensland property.
The workbook has 100 prepared rows, so you can enter a short list of genuine offers rather than inventing a database of retailers. The Dashboard then identifies the lowest estimated annual cost, average cost and monthly equivalent. Treat those as comparison results, not a guarantee of the next bill: actual consumption, seasonal demand and contract conditions still affect the amount.
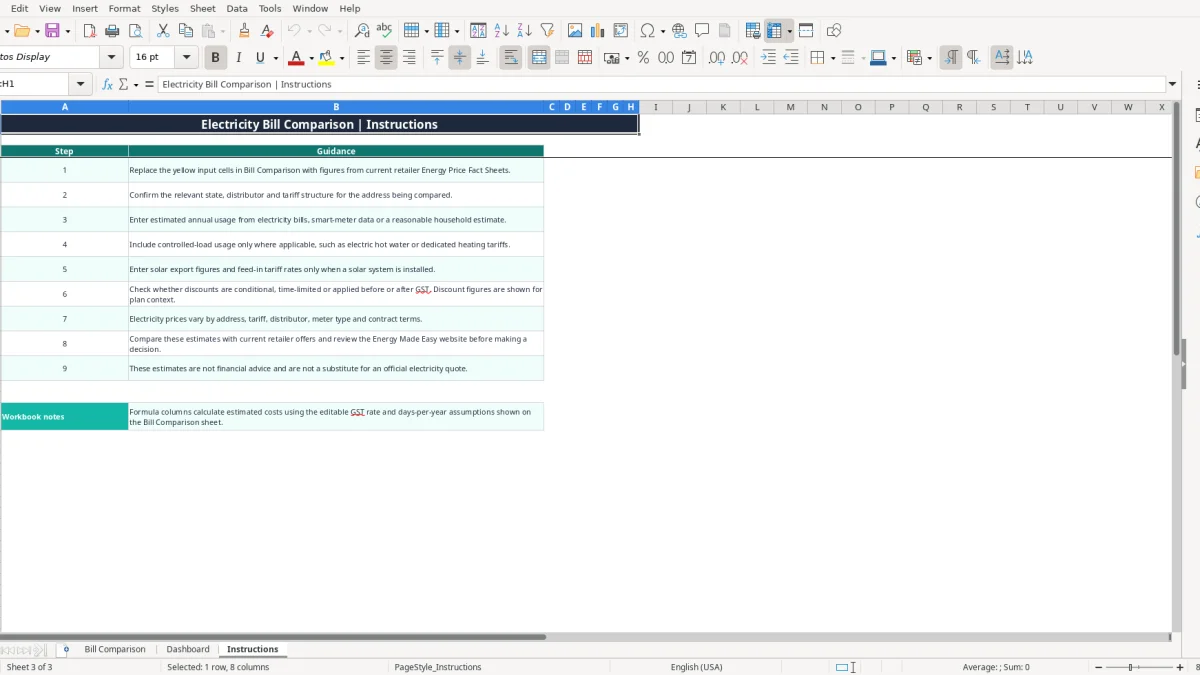
Australian electricity comparisons need address-specific information. Distribution zones, meter type, tariff structure and the current Energy Price Fact Sheet affect the offer, so enter the state and distribution zone before judging a rate. The Instructions sheet specifically directs you to confirm the relevant distributor and tariff structure for the address.
The Bill Comparison assumptions show a GST rate of 10% and 365 days per year. For example, if a plan produces $1,800.00 of estimated annual cost before GST, the GST calculation is $180.00 and the estimated annual cost including GST is $1,980.00, or $165.00 per month. The workbook calculates these values through the formula columns; do not overwrite them with rounded estimates.
Electricity charges and solar credits need to be read from the offer’s pricing documents. This workbook’s stated treatment deducts the solar credit from electricity charges before GST. That is a modelling assumption shown in Y7, not a substitute for checking how a retailer presents credits on its current offer.
Enter controlled-load usage only where the property has a separate tariff, such as dedicated electric hot water or heating. A household using 750 kWh of controlled load cannot safely compare a single usage rate with a plan that prices that consumption separately.
The Discount (%) field is included for plan context, but the calculated cost columns do not apply it to the cost formulas. If an offer says a discount is conditional, time-limited or applied only to particular charges, read the fact sheet and model the resulting rates directly. Check current retailer offers and Energy Made Easy before changing plans.
For a month-by-month view of generation, imports, exports and tariff costs, use a solar tariff tracker alongside this comparison workbook.
The most expensive comparison mistake is choosing the lowest usage rate while ignoring the daily supply charge. At 365 days, a supply charge difference of 30 cents per day costs $109.50 a year before GST. That can wipe out the saving from a small rate reduction, particularly in a low-use home.
A plan can look cheap because its usage rate belongs to a different distribution zone, meter type or tariff structure. A Victorian household entering a NSW distributor, or a controlled-load customer entering all usage as a single rate, produces a tidy spreadsheet result that does not describe the actual bill. Confirm the state, distributor and tariff from the current bill before entering rates.
Solar creates another trap. A 6 cents-per-kWh feed-in tariff is not a $6 credit per exported kWh; it is $0.06 per kWh. With 1,200 kWh of annual export, the credit is $72 before the workbook applies its stated GST treatment. Entering 1,200 as a rate instead of an export quantity can distort the result by thousands of dollars.
The Discount (%) field may make two plans appear easy to compare, but the workbook does not use that field to reduce the calculated costs. A displayed 20% discount might apply only to usage charges, expire after 12 months or require direct debit. Applying it across supply, usage and controlled load would create a false saving.
Another common error is replacing the formula outputs in columns N to W with manual numbers. That breaks the annual and monthly comparison, the rank and the Dashboard summaries. Keep the inputs in the plan fields and leave the calculated columns intact; if a result looks wrong, inspect the source rate, usage and solar assumptions first.
A spreadsheet only helps if you update it when prices or household use changes. Set aside 20 minutes when a retailer contract approaches its end, then save the current Energy Price Fact Sheets with the workbook so you can explain where each rate came from.
For example, if three plans show estimated annual costs of $1,980, $2,040 and $2,250 including GST, the lowest plan is $270 below the highest. That is a useful lead, but you should still check the contract term, exit conditions, conditional discounts and whether the quoted rates are current.
Use one row per plan and keep Plan IDs unique. The State field has a list validation for the eight Australian states and territories, while rate, usage, export and discount fields have numeric validation. Do not type currency symbols into numeric input cells, and do not replace formulas in the calculated columns.
Once you are tracking many properties, receiving frequent bills or needing automated imports and reminders, a spreadsheet may become too manual. At that point, an energy-management platform or a broader property system can be worthwhile; keep this workbook for a transparent side-by-side check of a small number of offers.