Bond Lodgement Excel Template Australia (2026)
3
Free download
Track rent, loan interest, vacancies and property expenses across eight Australian rentals with portfolio, monthly cash flow and dashboard sheets.
This rental property cash flow Excel spreadsheet tracks the income and running costs of Australian investment properties. It includes a Property Portfolio sheet for property-level figures, a Monthly Cash Flow sheet, a Dashboard for the overall position and an Instructions sheet to guide your entries.
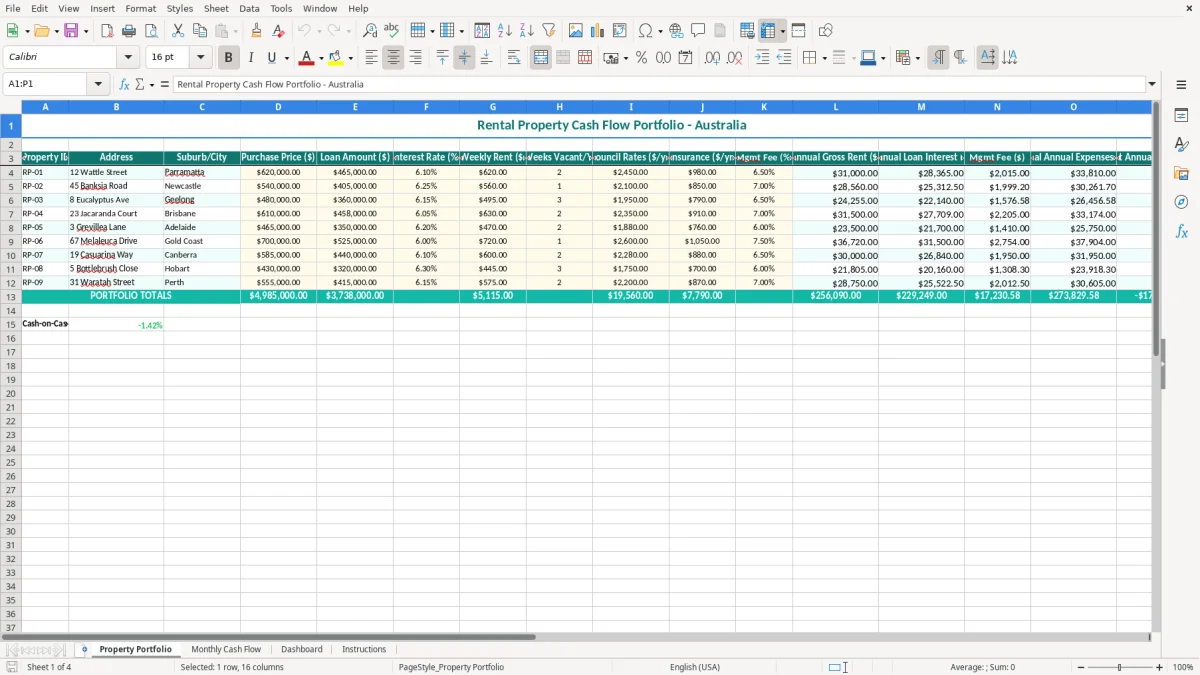
Enter the yellow input cells, including purchase price, loan amount, interest rate, weekly rent, vacancy, council rates, insurance and management fee. The portfolio calculations turn those figures into annual gross rent, loan interest, total expenses and net annual cash flow for each property.
A rental property cash flow spreadsheet is useful when you need to compare investment properties without opening a separate file for every address. A private landlord with one unit can use it before a refinance, while an investor with several houses can review the whole portfolio after rent is received and bills are paid.
Start with the proposed loan, rent and likely vacancy rather than the advertised yield alone. For example, a $465,000 loan at 6.10% gives estimated annual interest of $28,365. If rent is $620 a week and you allow two vacant weeks, annual gross rent is $31,000 before management, rates and insurance.
That leaves only $2,635 before the other annual costs in this workbook. Once council rates of $2,450, insurance of $980 and a 6.5% management fee of $2,015 are included, the example property shows why a high weekly rent does not automatically mean positive cash flow.
A property manager or bookkeeper can use the Property Portfolio sheet to keep the assumptions visible for each address. Image 1 shows the columns running from Property ID and Address through to Net Annual Cash Flow, so you can compare the same measures for each row instead of mixing figures between properties.
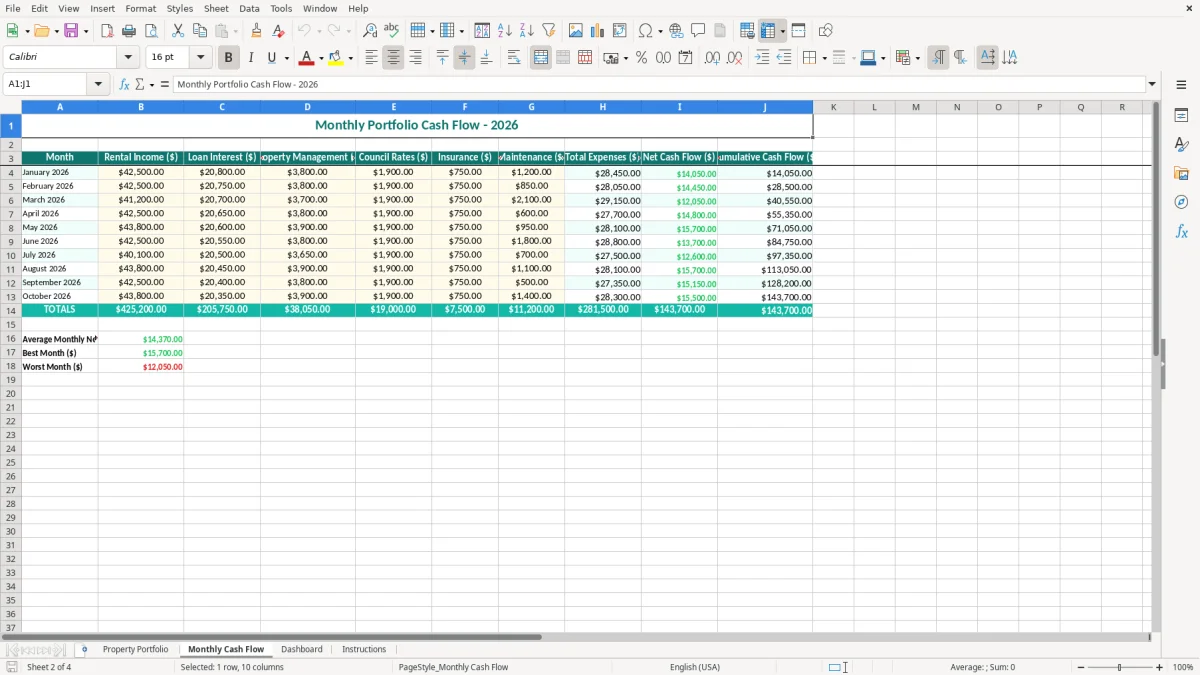
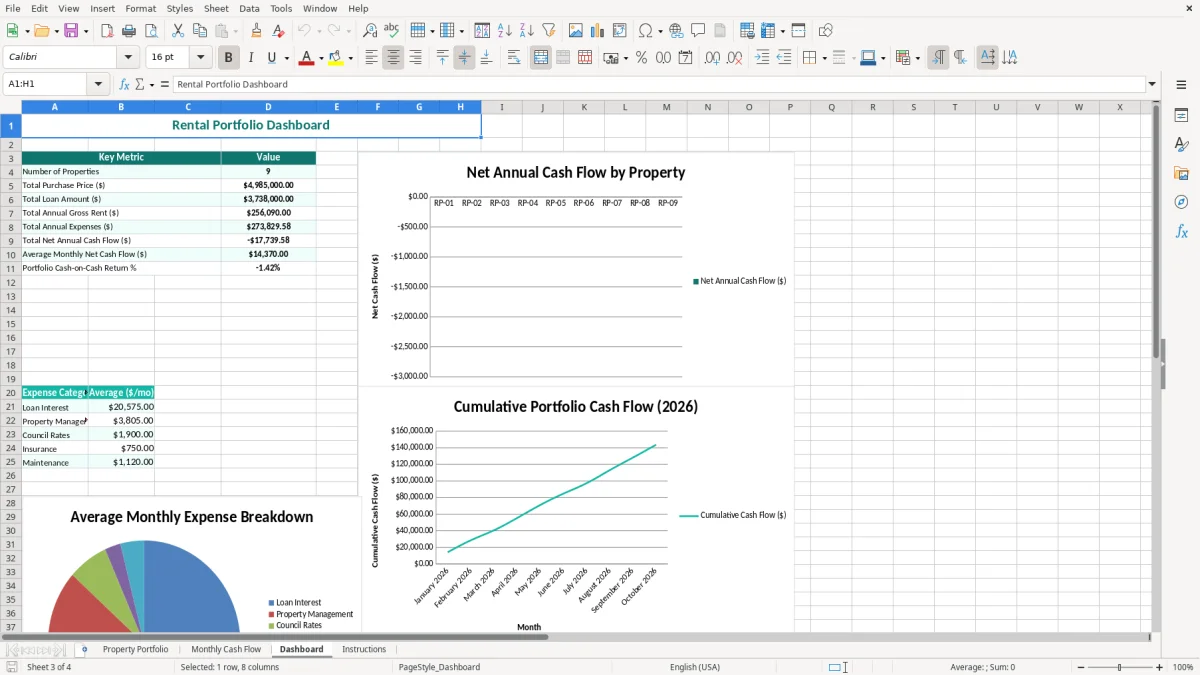
The Monthly Cash Flow sheet, shown as image 2, is the practical review point for an investor who checks receipts and bills each month. A landlord with eight properties might spend 20 minutes after the monthly statements arrive checking rent, interest and operating costs, then use image 3, the Dashboard, to see whether the portfolio is improving or slipping.
A sole trader investor may use the spreadsheet for planning, while a bookkeeper working for a small Pty Ltd can use it as a management report before posting transactions into accounting software. It is also useful at the start of a busy leasing period, when one extra vacant week across several properties can materially reduce annual rent.
This workbook is a cash-flow planning tool, not a tax return or a substitute for the ATO rental property schedule. Keep records for 5 years under the ATO record-keeping requirement, including loan statements, rental statements, council notices, insurance invoices and management fee invoices.
The portfolio calculation estimates loan interest as loan amount multiplied by the entered interest rate. On $405,000 at 6.25%, that is $25,312.50 a year. It does not calculate principal repayments, redraw effects, offset-account savings, establishment fees or changes from a variable rate, so do not treat the cash-flow figure as taxable income.
For tax purposes, interest on money borrowed to produce rental income may be deductible, but principal repayments are not. Depreciation is a separate non-cash deduction and is not included in the visible portfolio inputs. Capital works, repairs, borrowing expenses and private use also need separate treatment in your records.
Residential rent is generally input-taxed, so you do not add GST 10% to ordinary residential rent and you generally cannot claim GST credits for costs connected with that rent. Commercial property is different: GST registration is required once business turnover reaches $75,000 a year, or $150,000 for a not-for-profit, and commercial rent may require GST treatment and BAS reporting.
Do not use this workbook's weekly rent field to calculate a BAS amount without checking the property's use. If a $2,000 commercial invoice includes GST, the GST component is $181.82; a standard residential tenancy payment is not handled that way.
If the property sits in a Pty Ltd company, the company is a separate legal entity registered with ASIC, and the workbook should be reconciled to the company's bank and loan records. Keep the ownership, loan purpose and property address consistent across statements, and retain documents supporting every figure entered.
The biggest errors I see are not complicated Excel mistakes. They are optimistic assumptions copied into a spreadsheet: 52 weeks of rent, the wrong loan balance, an old interest rate or expenses entered for only one property while the owner is judging the whole portfolio.
If a property earns $620 a week but sits empty for 2 weeks, the realistic annual gross rent is $31,000, not $32,240. That $1,240 difference can turn a small surplus into a shortfall once a letting fee, advertising, repairs or a water charge arrives.
Another common error is entering monthly rent in the Weekly Rent column. Typing $2,680 instead of the weekly figure of $620 inflates annual rent to $134,000 before the vacancy adjustment. Check the unit of every input against the heading before relying on the result.
Using the purchase price instead of the loan amount overstates interest on a leveraged property. At 6.10%, applying the rate to $620,000 gives $37,820, but applying it to the actual $465,000 loan gives $28,365: a difference of $9,455 in the annual estimate.
Do not enter a 6.5% management fee as 0.065 unless the cell and formula are designed for decimal percentages. Also check whether the management statement includes GST or additional letting fees. The portfolio columns calculate the management fee from annual gross rent, so a wrong vacancy or rent input flows straight into that cost.
Council rates and insurance are visible inputs, but owners often leave out repairs, land tax, strata levies, water usage, inspection costs and principal repayments when judging bank cash requirements. A property showing $3,000 positive annual net cash flow can still need more than $250 a month from you if the loan principal is being paid down.
Finally, do not confuse cash flow with profit and loss. Interest is a cash cost, depreciation is non-cash, and a capital improvement is not the same as an immediately deductible repair. Reconcile the workbook to bank and loan statements before using it for an ATO decision.
Reconciling those charges often means separating levies, repairs and sinking-fund spending, which is exactly the structure of a body corporate budget.
The workbook works best when you update it at a fixed point, not when you remember it after a rate rise or a vacancy. Put a 20-minute review in your month-end routine, immediately after downloading each property manager statement and loan statement.
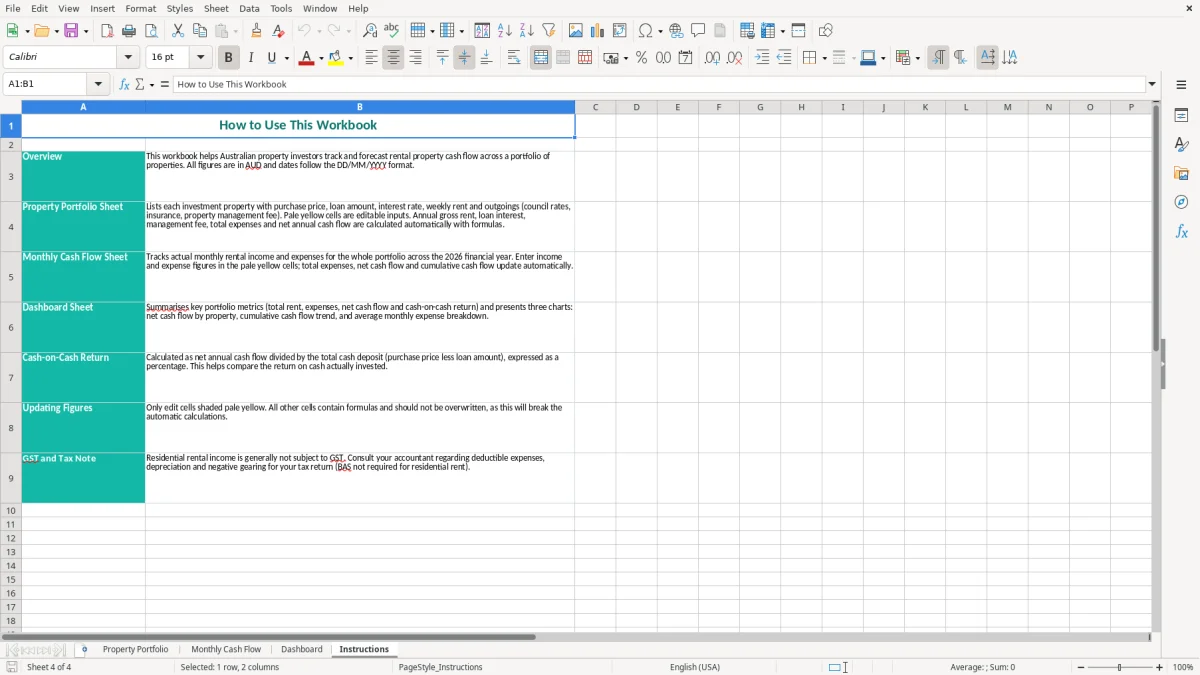
Use pale yellow cells as your entry points and leave calculated cells alone. If you add your own notes, use a consistent format such as 620 for weekly rent, 2 for vacant weeks and 6.5 for a management percentage, then use the Instructions sheet to remind anyone else entering data.
At the start of a financial year, enter a budget assumption; at month-end, compare it with the statement. For example, a forecast of $2,500 annual insurance should be replaced or annotated when the renewal invoice is $2,780, a $280 variance that is easy to miss in a yearly total.
When you have more than 10,000 transaction rows, multiple owners, trust distributions or regular reconciliations, move the transaction detail into software such as Xero or MYOB. Keep this spreadsheet for portfolio planning and scenario testing, but use accounting software as the source of truth for the bank, loan, ATO and tax records.