Rego Renewal Excel Template – Free (2026)
0
Free download
Track meter readings, kL usage, daily averages, targets, estimated GST-inclusive costs and suburb summaries across Australian properties.
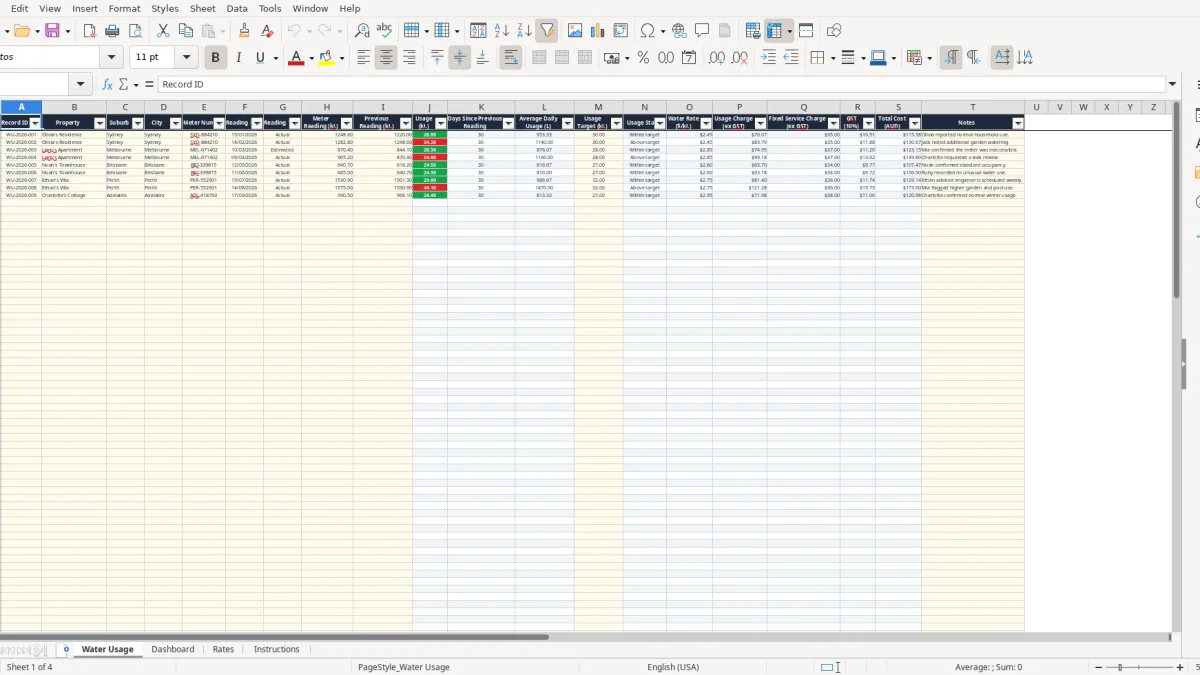
This water usage Excel spreadsheet records meter readings for Australian properties, calculates consumption in kL, daily averages, target status and estimated costs. It includes 109 prepared rows, suburb-based rates, a dashboard with three charts, and an instructions sheet.
Enter the reading date, property, suburb, meter number and current reading on the Water Usage sheet. The workbook calculates the difference from the previous reading, applies the rate and fixed charge from the Rates sheet, adds estimated GST at 10%, and summarises the result on the Dashboard.
A water usage tracker suits anyone who needs more detail than the total on a quarterly bill. A household budgeter can record a Sydney home's meter reading each month, while a property manager can monitor several units and keep each property's consumption separate. A small accommodation operator, body corporate committee or facilities manager can also use the same layout for routine checks.
Olivia's Residence in the sample data has a Sydney meter reading of 1,248.6 kL on 15/01/2026, with a previous reading of 1,220.0 kL. The spreadsheet calculates 28.6 kL of usage. The next reading is 1,282.8 kL on 14/02/2026, producing 34.2 kL over 30 days, or 1,140 litres a day.
That second result is useful when a household has started watering a garden, filling a pool or hosting more people. A landlord can record the reason in Notes rather than relying on memory when a tenant asks why consumption has changed.
A facilities officer looking after four sites can enter each meter against its property and suburb, then use the Dashboard's suburb summary. The prepared rows run from row 2 to row 110, so the workbook provides 109 operational entry rows rather than merely displaying the four sample records.
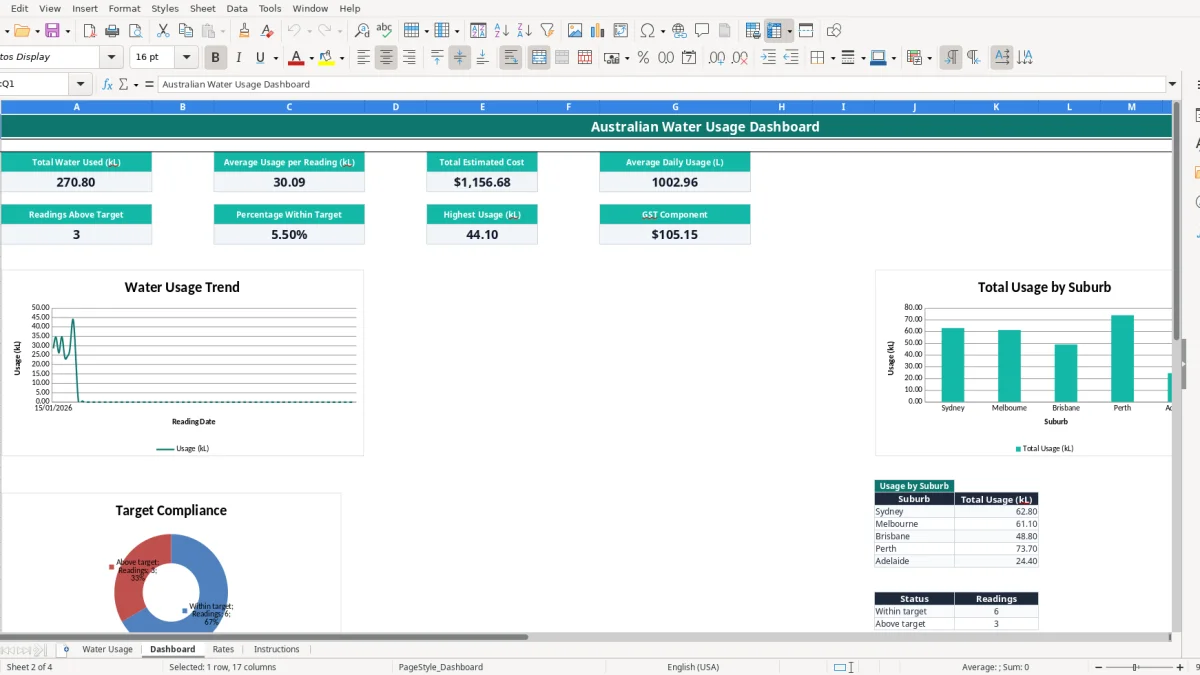
At the start of each billing period, take or copy the meter reading, enter the date in DD/MM/YYYY format and retain the previous reading. Keeping readings for the same property together matters because the Days Since Previous Reading formula compares consecutive rows for that property. For a quick monthly review, the Dashboard reports total water used, average usage per reading, highest usage, estimated cost and the percentage within target.
The tracker is most valuable after an unusually high bill, a suspected leak or a change in occupants. A 30 kL target followed by 42 kL actual usage is not proof of a leak, but it gives you a precise exception to investigate rather than a vague feeling that water use has risen.
For a shared apartment or townhouse complex, a body corporate budget can place water estimates alongside other common-property costs when reviewing actual spending.
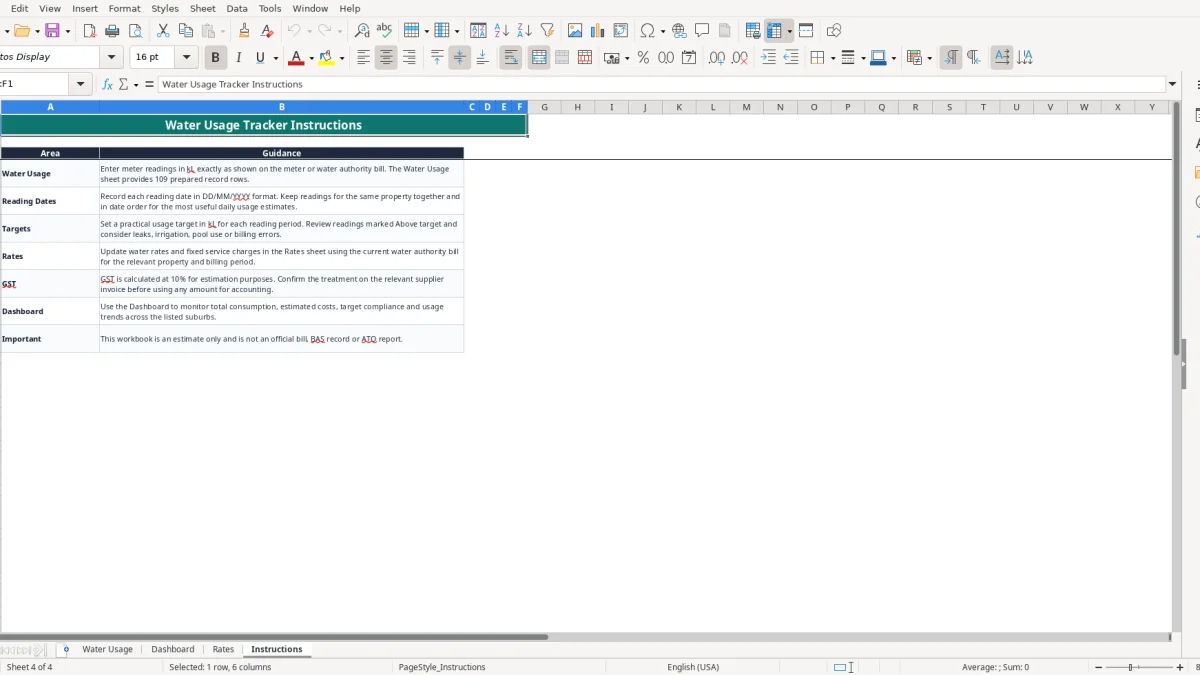
This workbook is an estimate, not an official Australian water bill, BAS record or ATO report. The Instructions sheet says to confirm tariffs, fixed charges and billing periods with the relevant water authority, and the Rates sheet repeats that actual tariffs can vary by authority, property type and period.
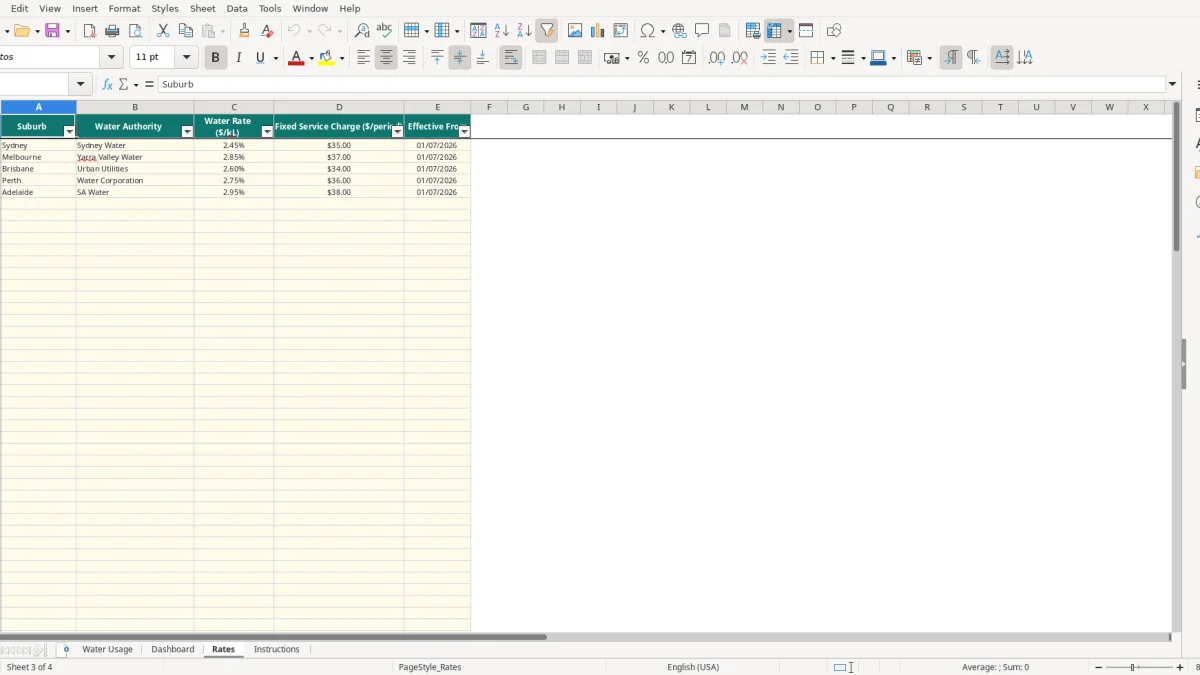
The sample Rates sheet lists Sydney at $2.45 per kL with a $35 fixed service charge, Melbourne at $2.85 and $37, Brisbane at $2.60 and $34, Perth at $2.75 and $36, and Adelaide at $2.95 and $38. Each sample rate has an effective date of 01/07/2026. These are workbook estimates and must be checked against the current bill.
The Water Usage sheet uses VLOOKUP to find the suburb in Rates and return the water rate and fixed service charge. For 28.6 kL in Sydney, the estimated usage charge at $2.45 per kL is $70.07. Add the $35 fixed charge to reach $105.07 before GST; the workbook calculates $10.51 GST and a $115.58 estimated total.
The workbook applies 10% GST to the usage charge plus the fixed service charge. That is a calculation setting for estimation, not a decision that every water amount is claimable. Check the supplier's tax invoice, particularly where the property is residential, mixed-use, tenanted or connected with a registered business.
For a GST-registered business, the ATO generally expects business records to support transactions and those records are normally kept for 5 years. A water authority bill is the source document; this spreadsheet should help you compare usage and budget costs, not replace the bill or determine an input tax credit by itself.
Water pricing is administered by the relevant state or territory authority and retailer arrangements differ. Confirm whether the bill covers 30, 60 or 90 days, whether the fixed charge is daily or per billing period, and whether a separate sewerage or service item appears. The workbook's fixed charge is a single input per period, so it should not be treated as a complete tariff schedule.
For landlords monitoring several properties, a rental property cash flow workbook can keep water payments among broader portfolio cash movements without replacing the water bill.
The most expensive errors usually start before Excel calculates anything: a meter is read incorrectly, a property is selected incorrectly, or two readings are entered out of order. The formulas can then produce a neat number that is still wrong. Treat the meter bill and a dated photograph as the evidence, and use Notes to explain estimates or unusual conditions.
If the current reading is 1,248.6 kL and the previous reading is accidentally entered as 1,286.4 kL, the calculated usage becomes negative or is hidden by the workbook's error handling. A reversed entry can distort the Dashboard's total and average. If the wrong property's previous reading is used, a 20 kL household period could appear as 200 kL, triggering unnecessary leak investigations.
Readings for the same property should stay together and in date order. The Days Since Previous Reading formula uses the difference between consecutive dates when the property matches; otherwise it defaults to 30 days. That default is convenient, but it is not evidence that the bill covered 30 days.
A rate of $2.45 per kL applied to 50 kL gives a $122.50 usage charge. If the authority has moved to $2.70, the difference is $12.50 before any fixed charge or GST. Across 12 similar periods, stale pricing could understate the usage component by $150.
Do not treat the displayed $115.58 example total as an invoice amount. The Dashboard labels the figures as estimated, and the workbook itself warns that tariffs, fixed charges and billing periods must be confirmed. Copy the bill's actual dates and charges into your review notes where the estimate differs.
A target of 30 kL is only useful if it matches the property and period. Comparing a 90-day bill with a 30 kL target can label normal use as Above target. Conversely, leaving a target too high can conceal a leak. A 34.2 kL result against a 30 kL target is a 4.2 kL exception worth checking for irrigation, visitors, a running toilet or a billing adjustment.
The spreadsheet works best when meter readings become part of an existing routine rather than a task you remember only after the bill arrives. Choose one day each month, read every accessible meter, save the bill and enter the information before moving on to other bookkeeping or household budgeting.
For a five-property review, allow roughly 10 minutes per property for the reading, bill check and entry. That is less than an hour each month and gives you a usable 12-month history if you keep the file consistently.
Set a quarterly reminder to compare the Rates sheet with the latest authority bill. The workbook includes Sydney, Melbourne, Brisbane, Perth and Adelaide sample rows, but those entries are not a guarantee of the current tariff. Update the water rate, fixed charge and effective date rather than changing formulas on Water Usage.
On the Dashboard, check total kL, estimated cost, GST component, highest usage and the three charts. The workbook includes a usage-by-date chart, a suburb usage summary for five listed suburbs, and a status chart comparing Within target with Above target. These are review tools, not forecasts.
This file has 109 prepared Water Usage rows and no formal Excel table. If you need thousands of readings, automated bill imports, multiple tariff periods, user permissions or audit history, move to software such as Xero, MYOB or a specialist facilities system. Until then, a dated monthly copy and a saved source bill provide a practical control.