Property Depreciation Excel Template – Free (2026)
23
Free download
Investment property calculator for rent, expenses, loan interest, net rental result, tax benefit and after-tax cash flow.
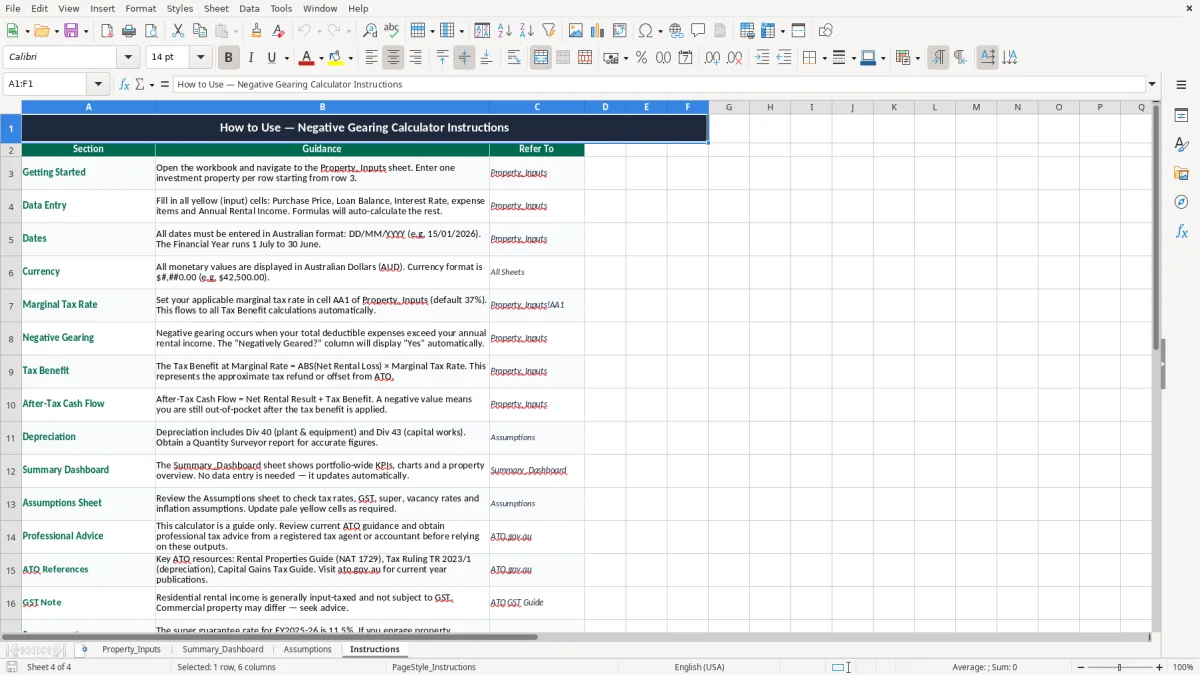
This negative gearing calculator is an Excel spreadsheet for working out the rent, deductible expenses, net rental result, tax benefit at your marginal rate and after-tax cash flow for one or more investment properties. It includes a property input sheet, a summary dashboard, an assumptions sheet and instructions.
Use it when you want a clear view of whether your rental property is running at a loss and what that loss is doing to your tax position. The layout is built for Australian investors, with fields for loan balance, interest rate, council rates, insurance, depreciation and annual rental income.
If you are comparing two properties, or checking whether the numbers still stack up after a rate rise, this template gives you the figures in one place. It is also handy at BAS time for keeping the bookkeeping side tidy, even though the actual tax result is worked through in your income tax return.
People usually reach for a negative gearing spreadsheet when the numbers start to move and they want a quick answer, not a full tax work-up. That includes a sole investor with one unit, a couple with two rentals, or a bookkeeper helping a client with a small portfolio at tax time.
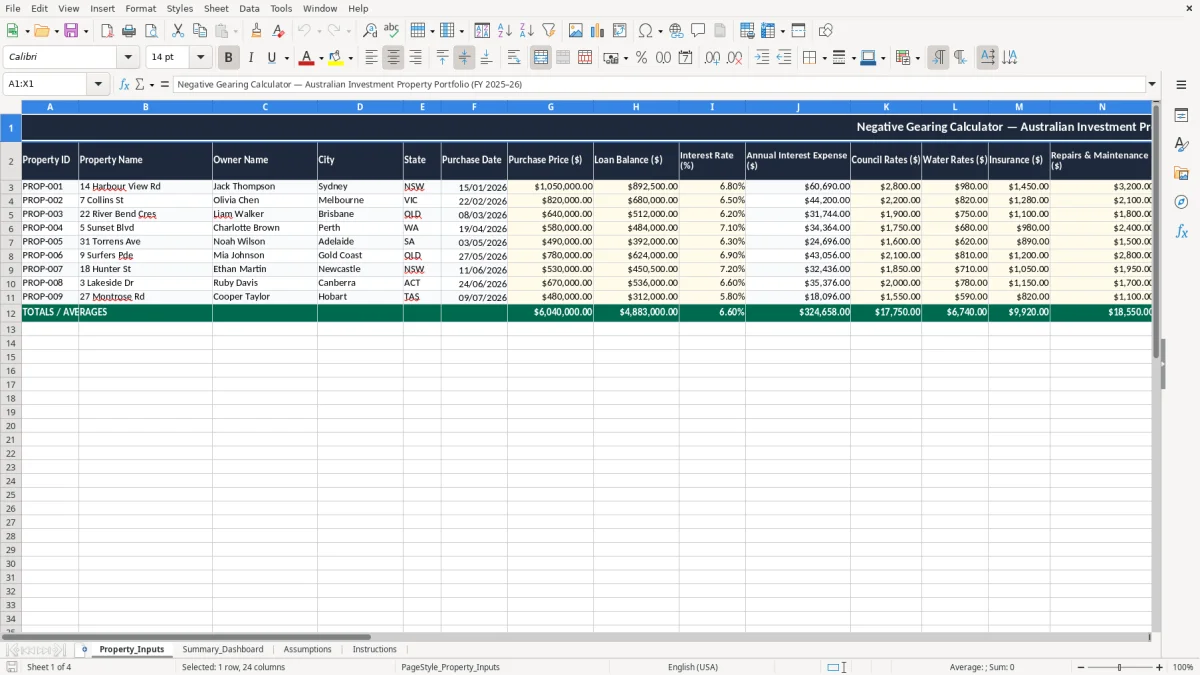
The Property_Inputs sheet is where the work happens. Image 1 shows the columns for property ID, property name, owner name, city, state, purchase date, purchase price, loan balance, interest rate and the expense lines that matter in real life: council rates, water rates, insurance, repairs, management fees, body corporate, depreciation and other deductible expenses.
Say you have 2 units. One brings in $31,200 a year in rent and the other brings in $28,600, but the first one has $34,900 in total expenses because of interest, rates and repairs. This template shows the loss straight away, then carries it through to the tax benefit and after-tax cash flow.
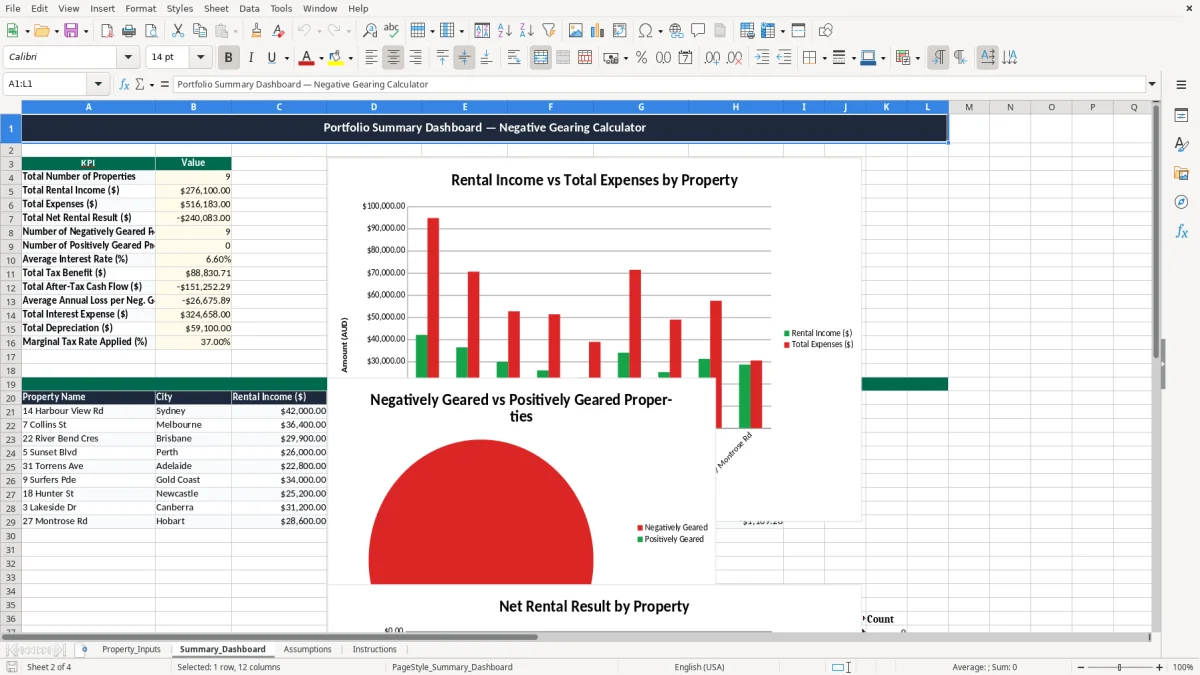
Image 2 is the Summary_Dashboard, which gives you the portfolio view instead of forcing you to add rows by hand. That is useful when you are comparing a property with $18,000 of annual interest against one that is only lightly geared and close to break-even.
For most landlords, a spreadsheet is enough until the file gets messy or the portfolio becomes too large. If you can update 3 or 4 properties in under 10 minutes, you are still in the sweet spot where Excel beats more clunky software.
For Australian tax, the key thing is not the label “negative gearing” but whether the expenses are deductible and properly recorded. The ATO expects records to be kept for 5 years, and that includes loan statements, agent statements, insurance invoices, council notices and repair receipts.
Rent and expenses feed into your income tax return, not your BAS unless you have a separate GST-registered activity. Residential rent is generally input-taxed for GST, so you do not add GST to the rent and you do not claim input tax credits on the residential rental itself.
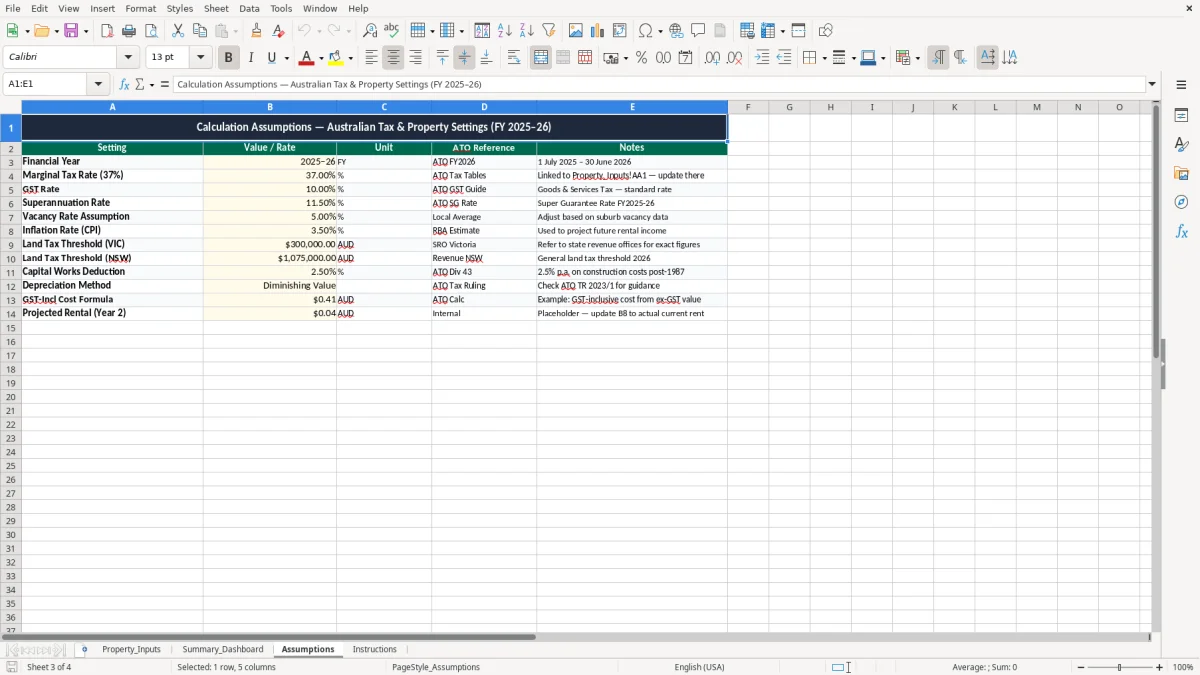
This workbook uses a marginal tax rate cell, set to 37% in the file. If your net rental loss is $8,500, the tax benefit at that rate is $3,145, because $8,500 × 37% = $3,145.
Negative gearing happens when deductible costs, such as interest and repairs, are higher than the rental income. If a property brings in $24,000 and costs $29,000 to hold, the result is a $5,000 loss before tax and a smaller cash loss after the tax deduction is counted.
If the property is in a Pty Ltd company or trust, the tax treatment can change, but the spreadsheet still helps you organise the figures cleanly. It is built around property-level tracking so you can hand the numbers to your tax agent without digging through bank feeds and PDFs.
When the property sits inside a self-managed super fund, the same clean tracking becomes essential for separating rental figures from the fund’s other transactions.
The biggest mistake is mixing cash flow with tax deductibility. A landlord can pay $12,000 in loan interest and still have a property that looks profitable on paper if repairs or depreciation have been left out, which means the after-tax figure is wrong from the start.
Another common problem is forgetting one-off costs, especially council rate catch-ups, insurance renewals and body corporate levies. On a property with $40,000 of annual rent, missing just $2,400 of expenses changes the net rental result by the same amount and can distort the tax benefit by $888 at a 37% marginal rate.
If the loan balance is typed as $280,000 instead of $820,000, the interest expense will be wildly off and the annual picture becomes useless. The same goes for using a monthly rate instead of an annual interest rate, which can understate costs by thousands.
Depreciation is easy to skip because it is not a cash payment, but it can still matter to the result. If the building and fittings schedule produces $4,500 of depreciation and you leave it out, you may overstate your taxable profit by that amount.
People often refinance, sell or hold a property based on a rough feel, then find the spreadsheet was understating the true annual drag by $6,000 or more. That is the difference between a property that is mildly negative geared and one that is chewing through cash every month.
The easiest way to keep this spreadsheet alive is to tie it to a routine you already do, like your month-end bookkeeping or the date your agent sends the rental statement. If you update it once a month, you will spot rate rises, repair spikes and vacancy gaps before they turn into a nasty surprise.
Turn your own checklist into a habit: enter the rent, then the loan interest, then the fixed holding costs. If one property has $2,150 in monthly rent and $2,480 in monthly costs, the monthly loss is obvious before you get to tax time.
If you are tracking a portfolio of 10 or more properties, or you need linked bank feeds and live statements, it may be time to move to proper accounting software such as Xero or MYOB. Excel is still great for analysis, but it is not a substitute for source records when the job gets bigger.
That shift usually means you also need a BAS tracking sheet to keep tax reporting tied to the source records as the portfolio grows.